One of the main reasons some people tend to avoid updating their PCs is that “it makes it slower”. Especially with Windows 10’s Software as a Service approach, where it gets the so-called “feature updates” twice a year. But is it actually true?
Today we’re gonna find out how much Windows 10’s performance has changed over time, by benchmarking 10 elements of the OS experience:
- Installation time
- Boot/reboot time
- Win32 app opening
- UWP app opening
- Windows Search
- GDI performance
- GDI stress test
- Windows Defender Quick Scan
- I/O performance
- Shutdown
But first, a little disclaimer: although I tried the best I could to compare the performance metrics as objectively as possible, there might have been some slip-ups in the measurements. For the purposes of this experiment I used Hyper-V as the hypervisor of choice, with 4GB of RAM, 4 cores and a 32GB fixed disk for each build.
Each version was clean installed.
So, without further ado, let’s go!
1. Installation time
The setup process is the end user’s first incursion into the OS experience. Over the last Windows versions (specifically Vista and later), Microsoft has made major strides in ensuring that the Windows installation is as smooth and efficient as possible. But how fast is it?
For each build, I made sure that I used an installation image that uses the .WIM format, for consistent and accurate results. Also, for objectively comparing speeds and reducing the human error to as little as possible, an unattended file was utilized.

As we can see, during the first 3 public release of Windows 10 the result is pretty consistent. However, after Creators Update, we can see an increase with about 3 minutes. The peak, however, is with Windows 10 October 2018 update (build 17763), where the installation takes a whopping 18 minutes and 40 seconds. After RS5, it seems that the installation process is a bit speedier, but not at the same level as the pre-RS2 builds.
Verdict: Windows 10’s setup process did get a bit slower, but not to a dramatic extent. This might be caused by the fact that subsequent releases of Windows 10 use more disk space, which obviously translates into longer write times.
2. Boot time
One of the most benchmarked areas of performance in an OS is the boot speed. It sets the tone in overall performance, as a system that boots slowly will most likely also run slow. Since Windows 8, the boot process has been significantly changed* to take advantage of modern storage devices such as SSDs.
* – the fast boot feature has been disabled for the purposes of this measurement.
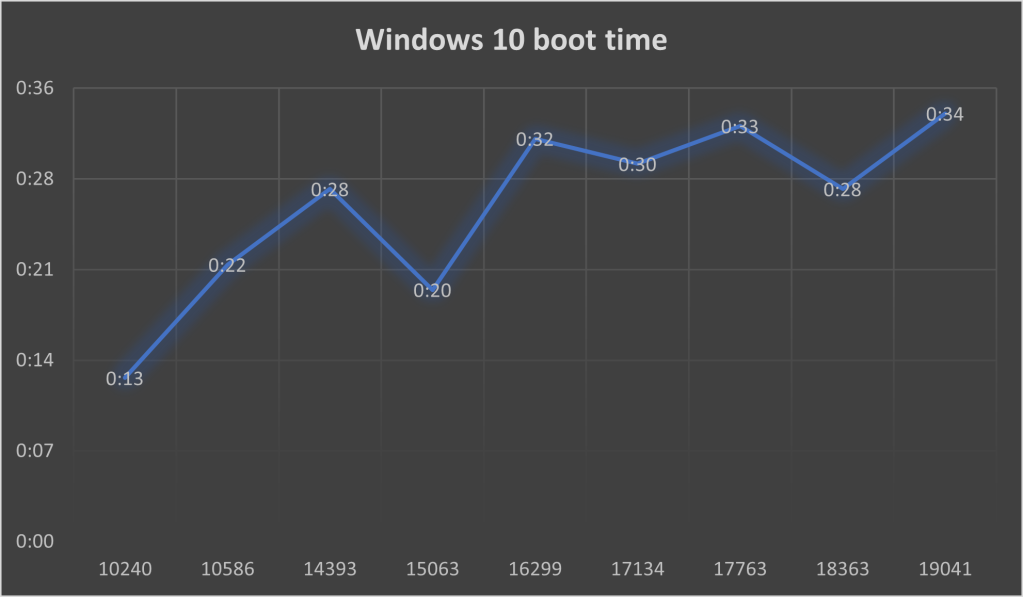
As we can see, the boot time did increase quite dramatically since Windows 10 Anniversary Update. (with a noticeable dip in Creators Update). If we compare Windows 10 TH1 with Windows 10 20H1, we have an increase of about 2.6 times. Of course, in this context it’s only a matter of mere seconds, but on a slower system it is definitely going to be a lot more noticeable.
For reboot time, the graph is pretty similar.
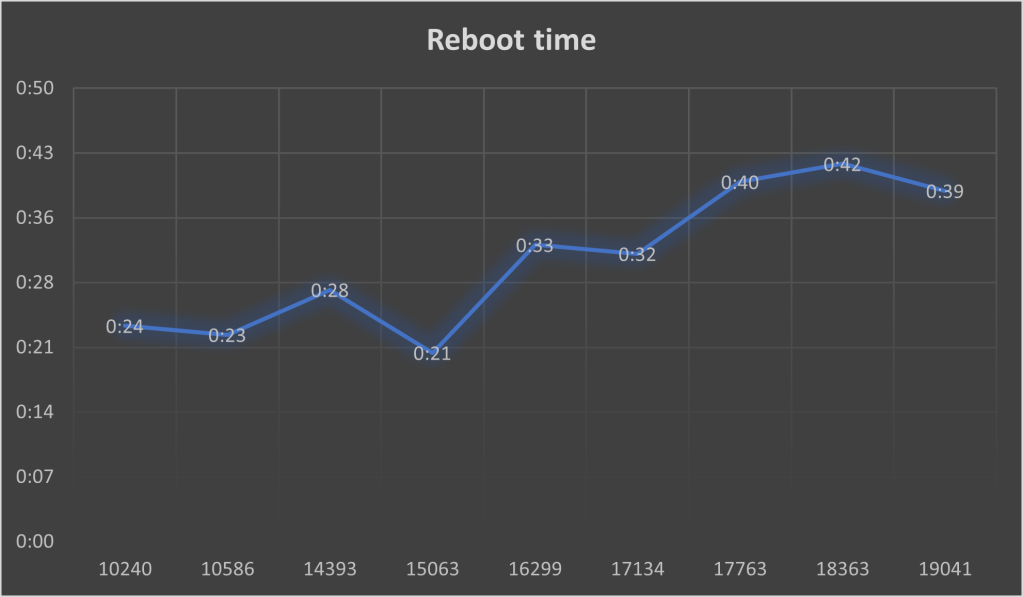
Verdict: The boot times did in fact get slower with subsequent builds. This is probably caused by the new security technologies implemented in newer builds of Windows, as well as the new services introduced.
3. Win32 applications
Although Microsoft tried to make their UWP apps as the future, to this day Win32 is still what makes Windows… Windows.
The apps I chose for this benchmark are all inbox Windows apps: Windows Explorer, winver, Notepad, Internet Explorer, Paint, Registry Editor, msconfig, msinfo32, Wordpad, Control Panel and Task Manager.

Again, we can see that we have a pretty significant slowdown starting with Windows 10 1809, being twice as slow as the previous build. Again, if we compare the lowest point with the highest, we have a difference of more than 3 times. Not a good look.
Verdict: Win32 programs will most likely open slower in newer builds of Windows.
4. UWP applications
Universal Windows Platform is (or was, depending on who you ask) Microsoft’s application platform for their “One Windows” vision. UWP is supposed to facilitate app development, so that one can write an app once, and then it would run on a plethora of devices. Unfortunately nowadays, UWP is in an awkward position of being somewhat neglected by Microsoft, thing that can especially be seen in the Store.
The apps that were benchmarked are: Microsoft Edge, Settings, Calculator, Calendar, Maps, Movies and TV, Groove Music, People, Store and Voice Recorder

We have some pretty dramatic results in this area. Again, things worsened dramatically starting with 1809, with the peak being with 19H1. The results couldn’t be more clear.
Verdict: Opening UWP apps did become dramatically slower with subsequent feature updates.
5. Windows Search
For the purpose of this experiment, I used Windows Search to find all instances of msinfo32 in the C: drive. Let’s check the results:

Here, unlike our other benchmarks, the results are varying wildly, so we can’t say for sure that we have a regression.
Verdict: Inconclusive results.
6. GDI Benchmark
For this test I used ADeltaX’s REGDI32 benchmark, which creates 9900 GDI handles, just below the maximum threshold of 10000. This program benchmarks the time it takes to render all the handles. Let’s take a look:

As we can see, we had a steady growth until Windows 10 19H1, which ended with a dramatic drop with 20H1. So, it looks like whatever was going on with the GDI performance was fortunately fixed, which is a refreshing sight.
Verdict: GDI performance used to get slower with each subsequent release, but it got fixed.
7. Explorer stress test
For this benchmark I created a very simple batch script which opens instances of File Explorer until GDI depletion. This tests not only the GDI rendering speed, but also Win32 opening times. The faster it takes to see visual artifacts, the better.

We have yet again a major increase in time starting with Windows 10 1809. Although we saw in the previous segment that GDI performance was dramatically improved with 20H1, it still didn’t help all that much in reducing the time until depletion. As such, we can conclude that the prolonged time is caused by Win32 app opening speed being lower.
Verdict: It takes more time to open enough Explorer instances that the OS will be out of GDI handles.
8. Windows Defender Quick Scan
Whether we love it or hate it, Windows Defender has become a more and more integrated part with Windows, each feature update adding new improvements to it. But what about doing an good old quick scan? Let’s see if it got slower or faster:
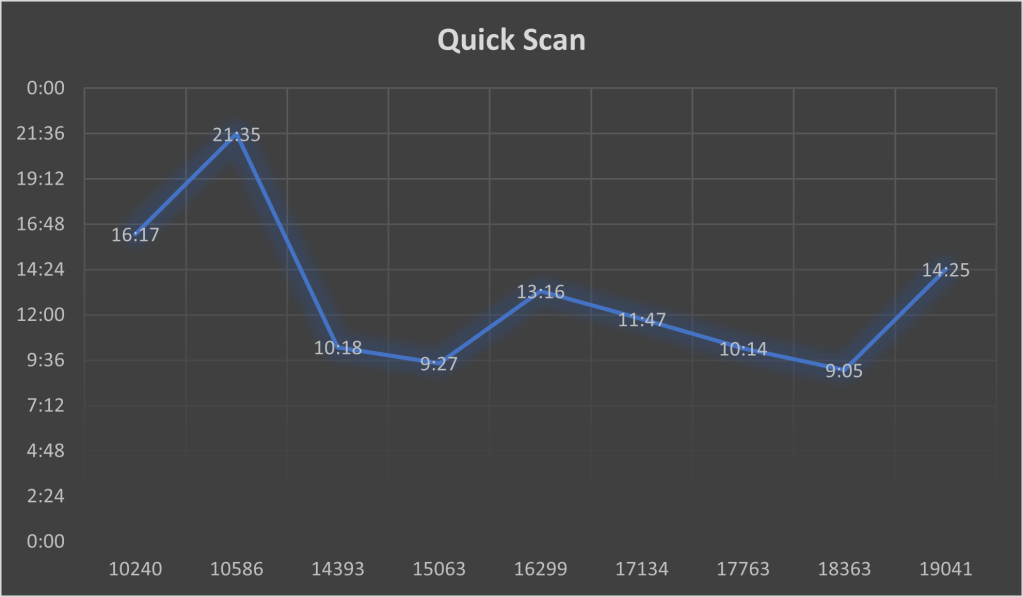
Looks like after Anniversary Update, the scan speed got much faster, and while newer builds have varying results, they are still much better than the first two releases of Windows 10.
Verdict: Windows Defender not only got smarter, but it also is a lot faster compared to initial releases of Windows 10.
9. Disk I/O performance
For this benchmark I used diskspd, which is a free, open-source utility provided by Microsoft for testing the I/O subsystem performance.
The command used is diskspd -c1G -d300 -r -w40 -o32 -t8 -b64k -Sh -L
The following chart shows the total I/O read and written.
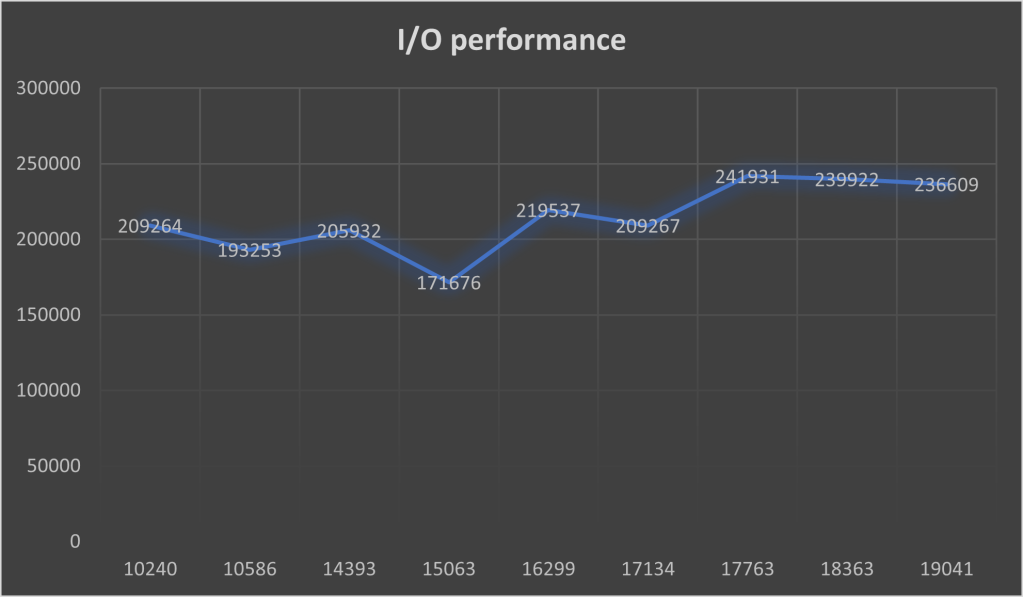
In an interesting turn of events, Windows 10 1809 is actually the fastest of the whole bunch of builds. It looks like Microsoft did some improvements to the I/O subsystem, as these changes persisted over to the next releases.
Verdict: Windows 10’s I/O performance is somewhat better nowadays.
10. Shutdown.
Last, but not least, we can’t finish benchmarking the OS experience without measuring the shutdown speed. Although not that important overall, it still gives us an impression of the whole OS tenacity.
Let’s see.

Verdict: The results are pretty consistent across the board, which means that the shutdown speed is in broad lines the same.
So, let’s answer the question: Did Windows 10 become slower over time?
Well, kind of. However, most of the people will not notice this regression. We have also seen some notable improvements in the I/O department, as well as security.
Why did this happen?
We can blame a lot of things that may have caused this regression. Some might say the lost interest for mobile devices by Microsoft made them not as vigilant in fine-tuning every component to its maximum performance (as some of you might know, Windows Phones were praised for their excellent performance, even on low end hardware). Other might put the blame on the enhanced security Windows has nowadays. Gone are the days where one might get viruses easily from the internet, as Windows Defender has an ever-growing grip on the end user’s ability to modify the OS as they please.
If you want to see a video walkthrough of some of the benchmarks taken, you can check it right here:
Thank you for your attention.

Leave a comment